Types of Data in Machine Learning
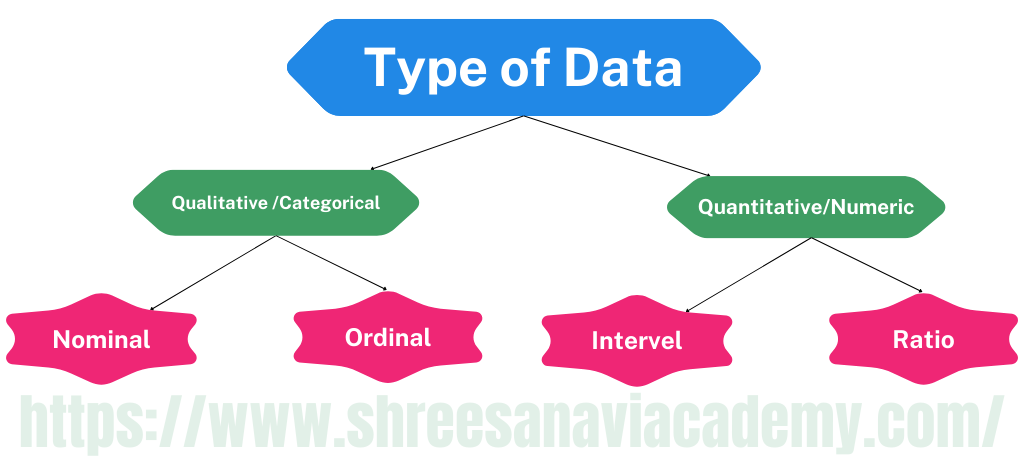
Data can broadly be divided into following two types:
- Qualitative data
- Quantitative data
Qualitative data
Qualitative data refers to information that is not numerical in nature, but rather descriptive or categorical. It often involves collecting data through methods such as observations, interviews, and surveys. Qualitative data can provide insights into people's attitudes, beliefs, behaviours, and experiences. Examples of qualitative data include text data, images, videos, and audio recordings. Unlike quantitative data, qualitative data cannot be easily analyzed using mathematical or statistical techniques, but rather requires techniques such as coding and thematic analysis to identify patterns and themes.
Qualitative data offers information that cannot be measured about the quality of an object or information. The quality of student performance, for instance, as measured by the terms "Good," "Average," and "Poor," falls under the heading of qualitative data. Additionally, student names and roll numbers are data that cannot be measured using a scale. They would therefore be considered qualitative data. Categorical data is another name for qualitative data. Qualitative data can be further subdivided into two types as follows:
- Nominal data
- Ordinal data
Nominal data is one which has no numeric value, but a named value. It is used for assigning named values to attributes. Nominal values cannot be quantified. Examples of nominal data are
- Blood group: A, B, O, AB, etc.
- Nationality: Indian, American, British, etc.
- Gender: Male, Female, Other
Ordinal data, in addition to possessing the properties of nominal data, can also be naturally ordered. This means ordinal data also assigns named values to attributes but unlike nominal data, they can be arranged in a sequence of increasing or decreasing value so that we can say whether a value is better than or greater than another value.
Examples of ordinal data are
- Customer satisfaction: 'Very Happy', 'Happy', 'Unhappy', etc.
- Grades: A, B, C, etc.
- Hardness of Metal: 'Very Hard', 'Hard', 'Soft', etc.
Like nominal data, basic counting is possible for ordinal data. Hence, the mode can be identified. Since ordering is possible in case of ordinal data, median, and quartiles can be identified in addition. Mean can still not be calculated.
Quantitative Data
Quantitative data refers to information that can be measured or expressed numerically. It is often collected through methods such as surveys, experiments, and statistical analysis. Examples of quantitative data include measurements of length, height, weight, temperature, and time, as well as numerical counts, ratings, and rankings. Quantitative data can be analysed using mathematical or statistical techniques to identify patterns, relationships, and trends. This type of data is commonly used in fields such as finance, economics, and natural sciences, where objective measurements and statistical analysis are essential for decision-making and research.
Quantitative data relates to information about the quantity of an object — hence it can be measured. For example, if we consider the attribute 'marks', it can be measured using a scale of measurement. Quantitative data is also termed as numeric data. There are two types of quantitative data:
- Interval data
- Ratio data
Interval Data: Numeric data that is known for both the order and the precise difference between values is referred to as interval data. Temperature in Celsius is a perfect illustration of interval data. The temperature difference between each value stays constant in Celsius. The difference between 15.50 C and 21.50 C, for instance, is measurable and equal to 50 C. The difference between 110 C and 160 C is also equal to 50 C. Other examples include time and date.
Ratio data are numerical values that can be measured precisely. For ratio data, absolute zero is available. These variables can also be multiplied, divided, added, or taken away. The mean, median, or mode as well as dispersion methods like standard deviation can be used to calculate the central tendency. Data ratio examples include things like height, weight, age, and salary.