Histogram
It is pictorial representation of frequency of occurrence of an event
Histograms plots how many times each intensity values in image occurs.
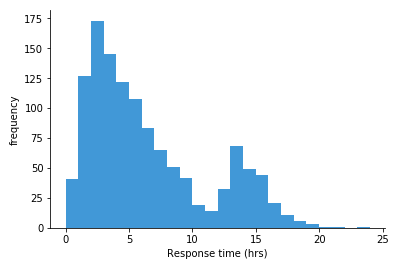
Historam Example
Image Histogram
Image histogram is a graphical representation of frequency distribution in an image. The histogram plots the number of pixel in the iamge (verticxal axis) with a particular intensity values (Horizontal axis) The histogram is a graph showing the number of pixel in a image at each different intensity value found in the image.
Example
8 bit gray scale image there are 256 different possible intensities and so the histogram will graphically display 256 numbers showing the distribution of pixel among those gray scale values.
Histograms can also be taken of color images --- either individual histograms of red, green and blue channels can be taken, or a 3-D histogram can be produced, with the three axes representing the red, blue and green channels, and brightness at each point representing the pixel count. The exact output from the operation depends upon the implementation --- it may simply be a picture of the required histogram in a suitable image format, or it may be a data file of some sort representing the histogram statistics.
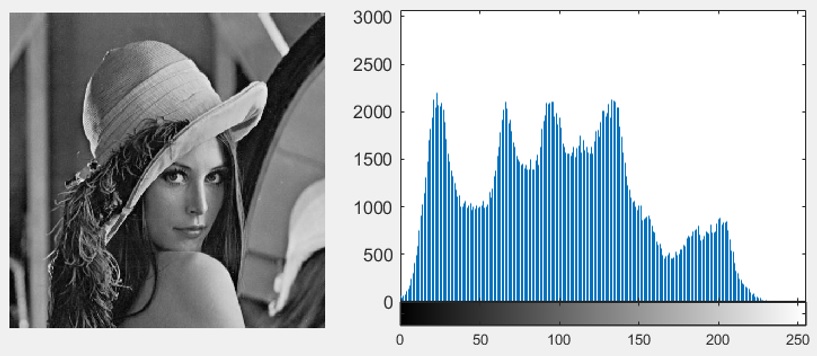
Image and Histogram of image